How to design a report
Once you have made your decision about creating either a report Item or rather a report Template you go ahead and select your desired chart type from the drop-down menu.
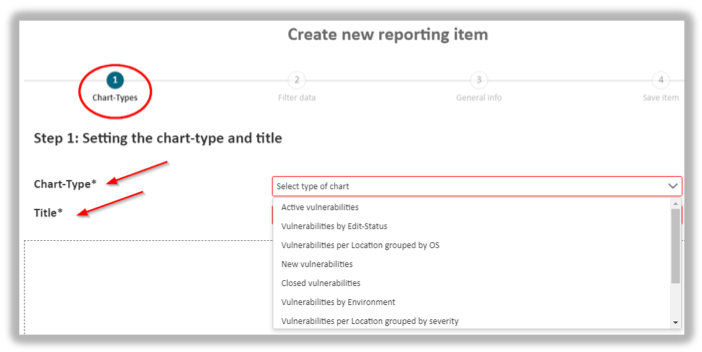
The report creation process is guided by a convenient progress bar. It shows you each required step, so you always know how far you have come during the report design process.
In a second step explain the purpose of the report by adding a descriptive title. The length of the title is restricted by 70 characters.
When done, press continue to save your changes.
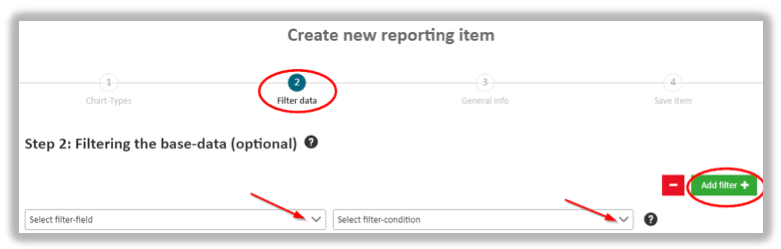
Once the report type and title have been defined you may restrict the report data by adding filters should that be necessary. This is usually the case if you already know that the report would otherwise retrieve too many or even irrelevant data.
Adding filters is not mandatory, however.
If you need to restrict data retrieval hit the Add filter button in the form. As an effect a new drop-down row will be available. Here you choose the relevant selection criteria along with a filtering condition. This provides the flexibility of configuring the conditions by what the results should be filtered.
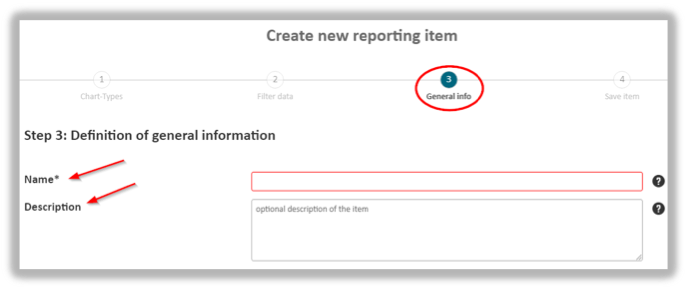
During the third step you provide general information as it pertains to the report. Here you are asked to give a name and a description. The Name text field is again mandatory.
Should you decide to make changes to the previous steps as outlined by the progress bar you may skip back using the “Back” button.
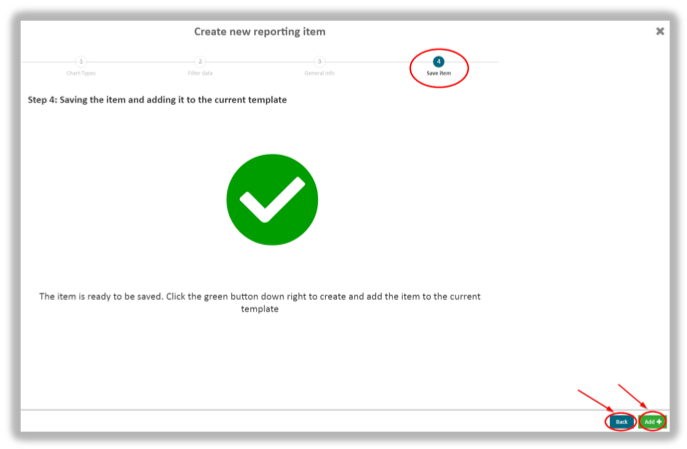
In the last step you save your report configurations.
In order to add the report to the dashboard use the Add+ button.
updated on: 5/9/2019 ⏐updated by: Wolfgang Stoettner ⏐ v1.0.1